Build your own carbon intensity monitor
While the Carbon Hack 22 is happening, I decided to create my own hacking project, a carbon intensity monitor. In this post, I'll describe how to put the monitor together, but you can just go directly to this project code on GitHub.
What's carbon intensity?
Carbon intensity is the rate of carbon emitted per energy
produced.
The power we consume at home will be on the scale of grams of CO2eq
per kilowatt/hour, or gCO2eq/kWh. So, if you have 100 gCO2eq/kWh carbon
intensity and 1 kW in an hour, the power grid emits 100g of carbon into
the atmosphere.
What's the purpose of knowing the carbon intensity?
Carbon intensity is not constant. Throughout the day, different energy mixes are present in the power grid. During the day, you have solar power, while at night, you don't. Here's an example of renewable sources in California throughout the day.
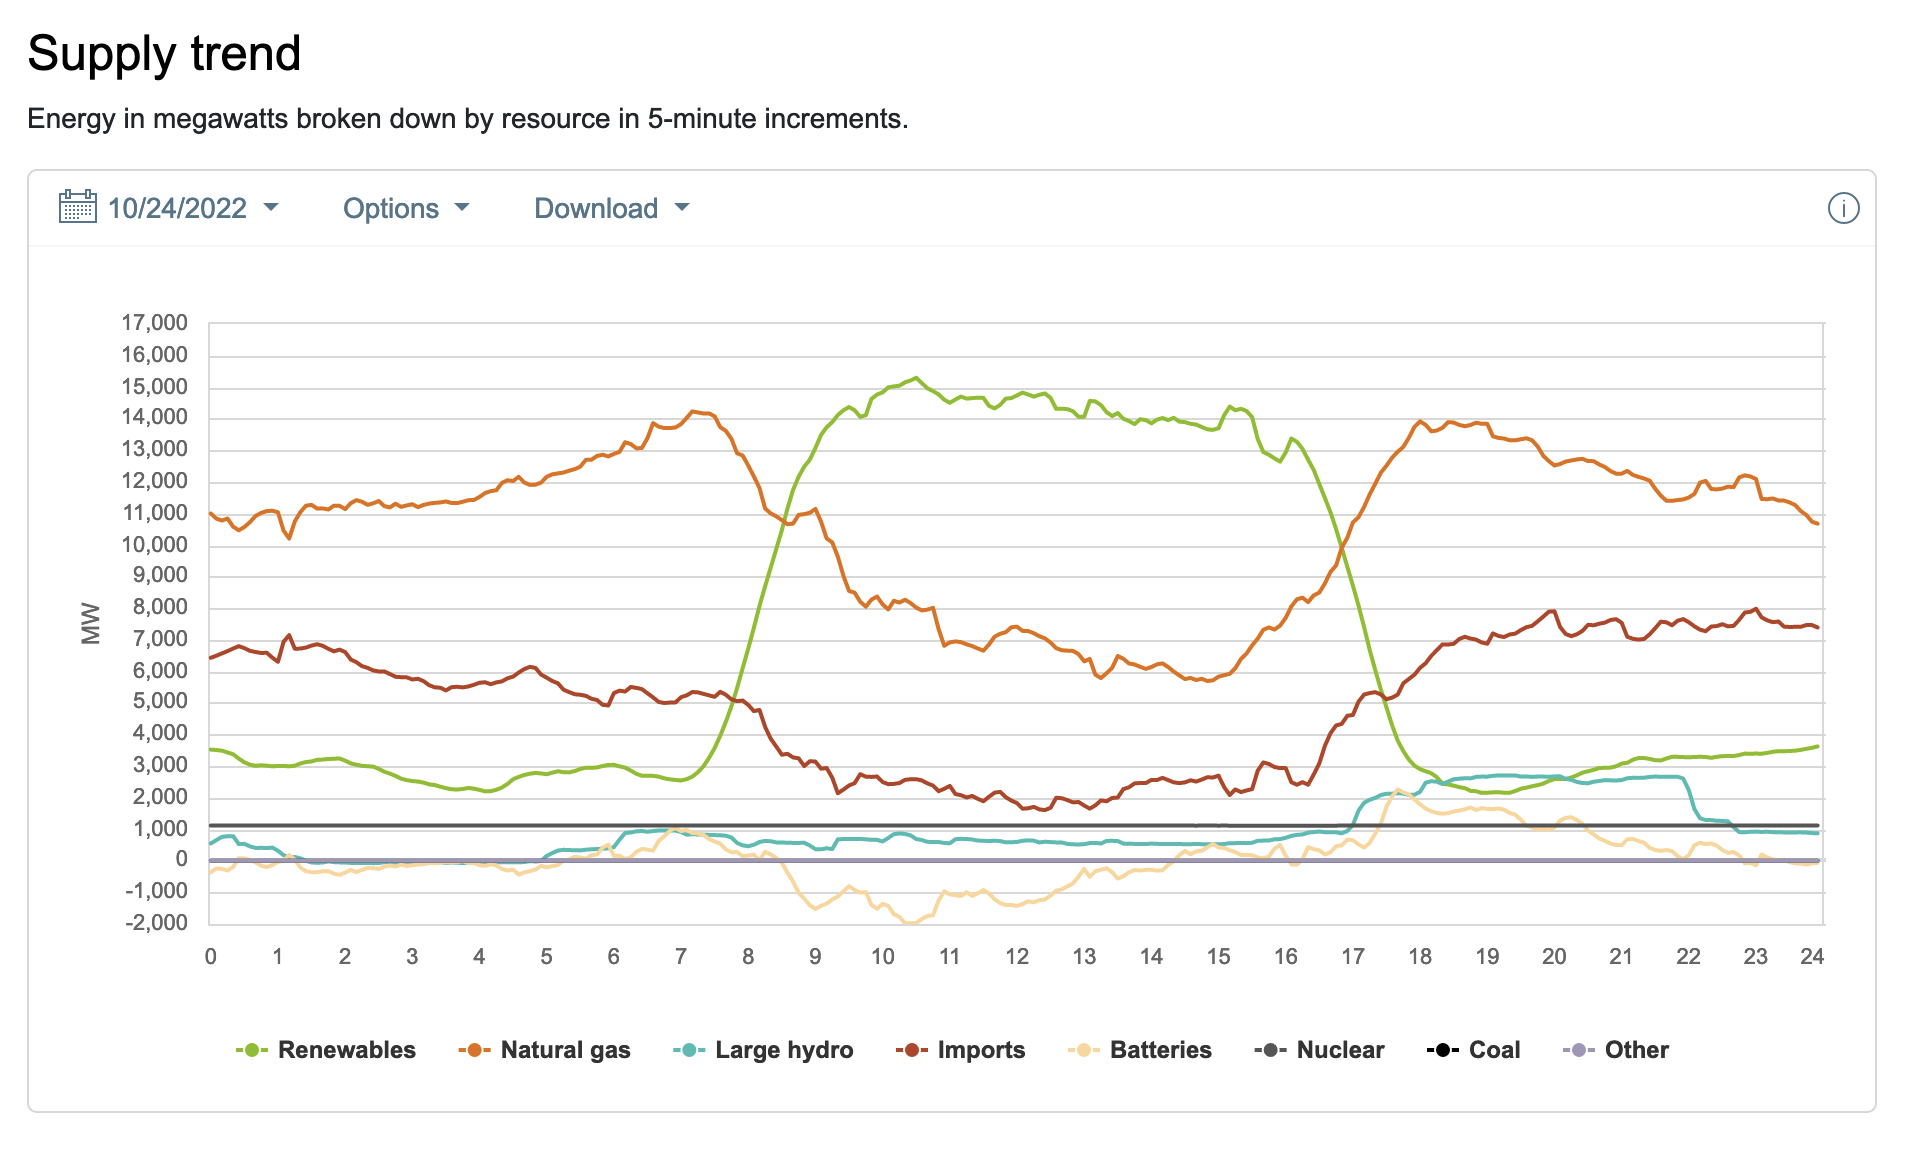
What that means is that the carbon intensity during the day in California is lower than at night because, at night, to cope with the absence of solar energy, natural gas enters the mix. If you want to emit less carbon while using power, you should use it when the carbon intensity is at its lowest.
Materials you will need
Raspberry Pi Pico W etc., are relatively cheap, but if you add tax and shipping, it would add to approximately 40 dollars.
- Raspberry Pi Pico W ($6.00)
- Pico Display Pack ($16.95)
- Raspberry Pi Pico Header Set ($1.95)
- micro USB cable ($2.95)
Note on soldering: You will need to solder the Header Set into the Pico W; If you do not want to do that, you can purchase a Raspberry Pico W Pre-Soldered on amazon.com ($14.49)
Note on prices: These prices are from the time I'm writing this post; They certainly can vary.
Note on USB cable: You probably have a micro USB cable. I've listed it just as a reminder you need one.
Soldering the Header Set
If you bought Raspberry Pi Pico W Pre-Soldered, you could skip this part
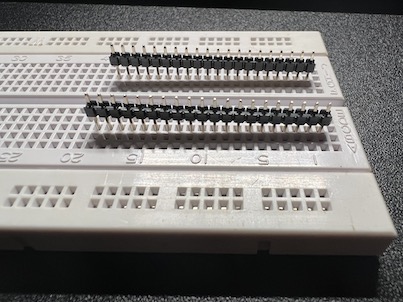
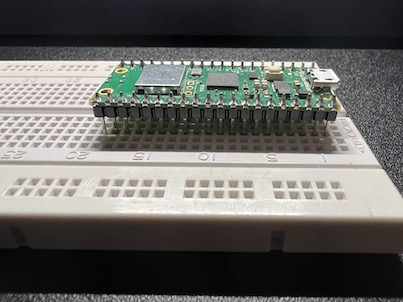
Soldering the Header Set is easy if you know how to solder. If you don't know, I recommend watching some tutorials on YouTube. It should be simple. You need to find a way to hold the thing together while you solder. In my case, a breadboard did the trick.
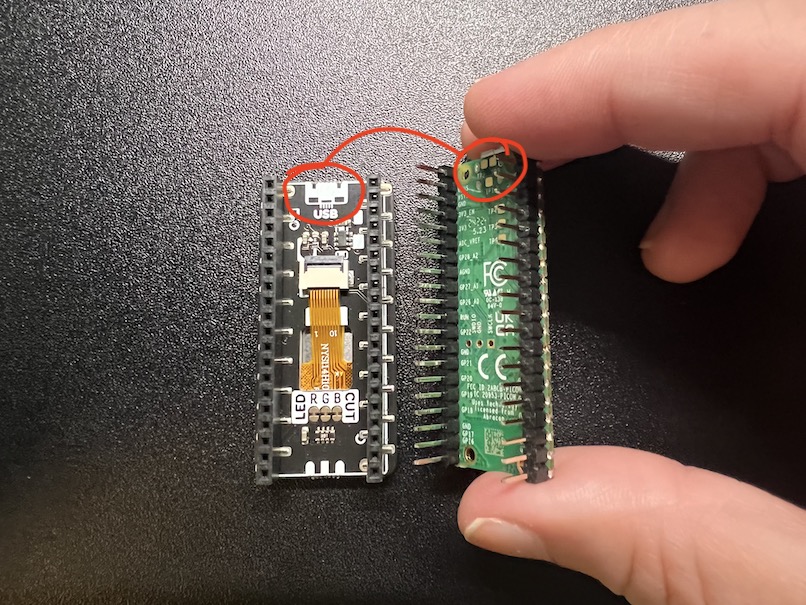
Assembling Pico Display with Pico
Join both, taking care of aligning the USB icon on the display with the USB on the Pico.
Preparing the Raspberry Pi Pico W for your code
We're going to use micropython for our code. So the first step is to add it to our brand new Raspberry Pico W.
Because we're going to use Pico Display, we are going to use its micropython image. This image contains everything you need, plus the graphics libraries we will use. So, we will follow the same steps described here. But we will download the image from Pimonori.
Adding micropython to Raspberry Pi Pico W
From Raspberry Pi's official documentation:

The instructions are simple:
- Download Pimonori's micropython image
- Press and hold the BOOTSEL button on the Raspberry Pi Pico W and connect it to the USB while holding the button
- The Pico should now show on your computer as a mounted drive/folder
- Copy the image you downloaded in 1. to Pico's folder; it will automatically unmount and reboot.
- Start using your Raspberry Pi Pico W
Writing and deploying your code into the Pico
The easiest and most friendly way to code in micropython for your Pico is to use the Thonny IDE. It has everything you need to write your code, plus it has a Python REPL, which is very helpful.
I suggest you try some tasks before diving into the final code:
1. Make the Pico led blink
This is the equivalent of Hello World in the world of microcontrollers.
import machine
import time

LED = machine.Pin("LED", machine.Pin.OUT)

while True:
    LED.on()
    time.sleep_ms(500)
    LED.off()
    time.sleep_ms(500)
2. Use some printing for later debug
Keep this at hand; you might need to inspect some values if things don't work as expected. I'm also showcasing that micropython supports f-strings.
import machine
import time

LED = machine.Pin("LED", machine.Pin.OUT)

for i in range(10):
    print(f'{i=}')
    LED.toggle()
    time.sleep_ms(500)
3. Connect to the Wi-Fi
The Pico has a 2.4GHz antenna, so you need a 2.4GHz Wi-Fi connection. Most routers are capable of 2.4Ghz network unless you explicitly disabled yours.
This code is from Connecting to the Internet with Raspberry Pi Pico W section 3.6. Don't use it for production. This code is missing handling connection errors.
import network
import time

wlan = network.WLAN(network.STA_IF)
wlan.active(True)
wlan.connect('Wireless Network', 'The Password')

while not wlan.isconnected() and wlan.status() >= 0:
print("Waiting to connect:")
time.sleep(1)

print(wlan.ifconfig())
4. Play with the Display
Now explore the capabilities of the display, Pimonori's picographics has an excellent API. You should check at least these demos:
Getting access to CO2signal API
For our carbon intensity data, we'll use CO2signal. It provides very convenient data for us with the intensity and percentage of fossil fuels in the power grid. Note that this API has rate limits, 30 requests in an hour and 1 request per second. So, be careful to not overwhelm their servers.
You will need to find the longitude and latitude of your home; you can use GeoNames for this.
After obtaining your API token you can test it like so:
% curl 'https://api.co2signal.com/v1/latest?lon=6.8770394&lat=45.9162776' -H 'auth-token: myapitoken'
{
    "countryCode": "FR",
    "data": {
        "carbonIntensity": 93.0727344671727,
        "datetime": "2017-02-09T08:30:00.000Z",
        "fossilFuelPercentage": 12.032514442152996
    },
    "status": "ok",
    "units": {
        "carbonIntensity": "gCO2eq/kWh"
    }
}
You can check the CO2 Signal documentation for more information.
Setting all up and deploying the code
Go to GitHub pico2eq and download this project code.
You will need to create a configuration file called config.json for pico2eq to work. Here's the template:
{
  "wifi": {
    "ssid": "YOUR_WIFI_NAME",
    "password":"YOUR_WIFI_PASSWORD"
  },
  "co2signal": {
    "token": "YOUR_API_TOKEN",
    "longitude": YOUR_LONGITUDE,
    "latitude": YOUR_LATITUDE
  }
}
You need to replace any YOUR_ with the appropriate information. This is sensitive information; take caution to not upload this file to the internet.
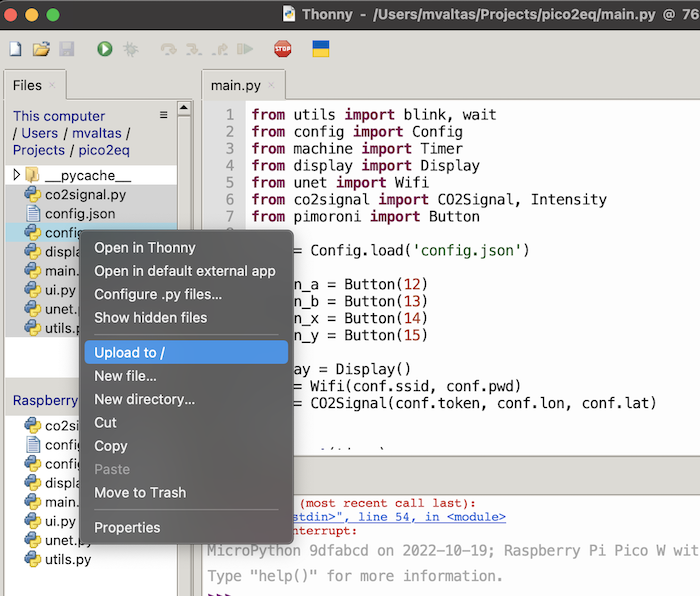
Once you have your configuration file, you can open Thonny and navigate to where the code is. You can now select everything and right-click to Upload to /.
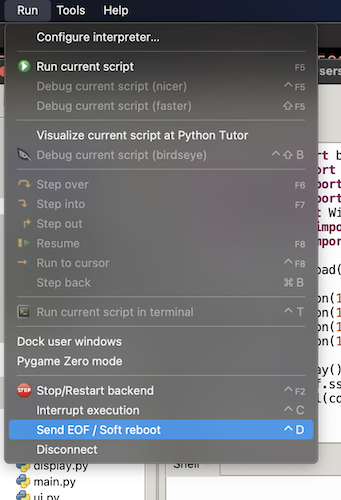
After uploading your files, you need to restart the Pico by selecting the Menu -> Run -> Send EOF / Soft-Reboot. Click on it and, the Pico should restart.
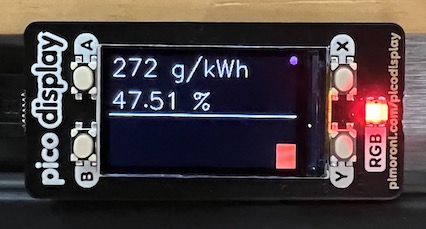
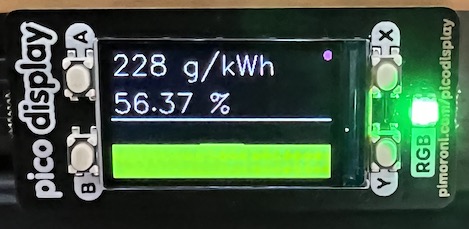
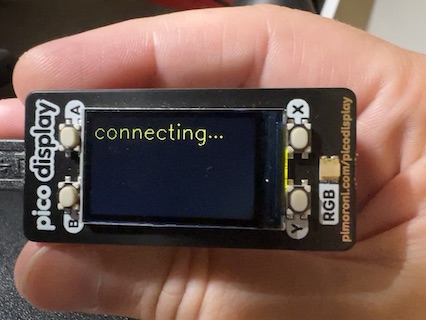
After rebooting, you should see a connecting... on the screen, and after some seconds, you should see your carbon intensity reading.
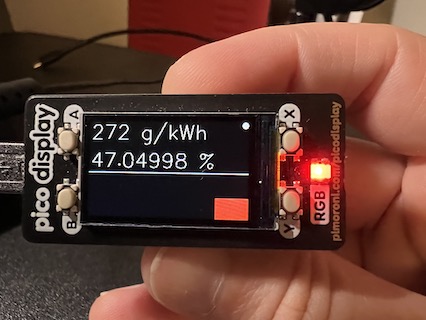
That's it; you now have your own Carbon Intensity Monitor.
For more information about the code, such as error codes, button functionality, etc., please go to the pico2eq project on GitHub.